
Hi!, I’m Sara Guerrero and I have been the last two months working in the StarFormMapper project at Quasar during my traineeship. During my stay my main task has been plotting the star positions and proper motions from Gaia together with the gas and dust from Herschel images. This is an example plot produced with the algorithm I worked on. The main input parameters for the algorithm are the Herschel and Gaia data and the number of stars. With this information the plot shown below is produced. This plot is interactive (see buttons to the right of the image).
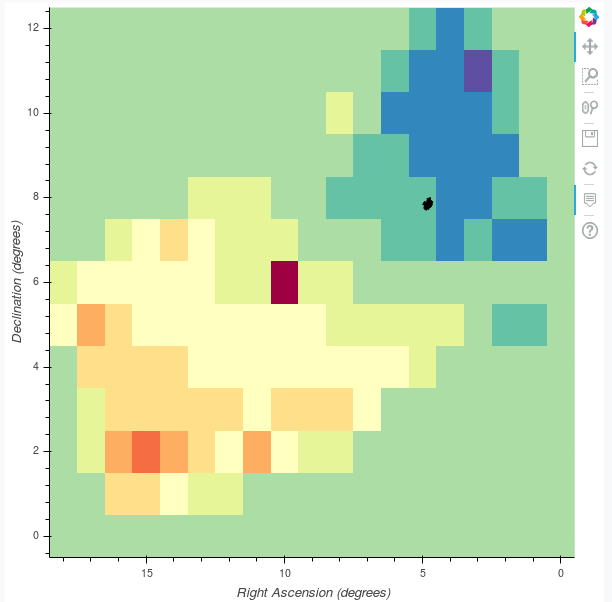
In the figure above it is possible to see the location of the Gaia star cluster (black dots). A zoom can be made at this location.
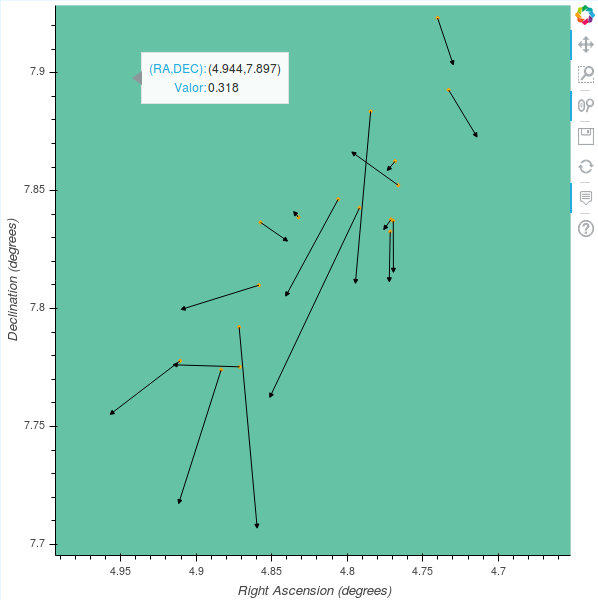
The background image of the figure above shows data from Herschel, the yellow circles indicate the positions of the Gaia stars and the black arrows shows the proper motions of each star.
During my internship at the company I have learned a lot, not only have I improved my code development skills with python, but I have learned some astrophysical concepts.
Now I know different types of files that are used in astronomy, like fits or VOTable formats, which are frequently used. I have also learned some IT concepts, like what a Docker is and got familiar with developing application front-ends like DEAVI, which is the application Quasar is developing for the SFM project. In short, I have really enjoyed my stay at Quasar, it was a great opportunity to experience how these big projects work from the inside.